Design, Development, & Campaign Performance TrackingCampaign Page & Analytics
Hunger Action Month
A rebuilt campaign page for Children's Hunger Fund with analytics designed in from day one: every channel tagged, every key interaction measured, and every donation traceable to where it came from.
113Donations completed in the campaign month
- Client
- Children's Hunger Fund—A Christian Non-Profit Ministry
- Role
- Designer, Copywriter, Developer & Analytics (sole developer)
- Platform & Tools
- WordPress
PHP, SASS, JavaScript, Google Tag Manager, Google Analytics 4 - Deliverables
- Landing page, homepage banner, event tracking, link-tagging plan, campaign dashboard
Overview
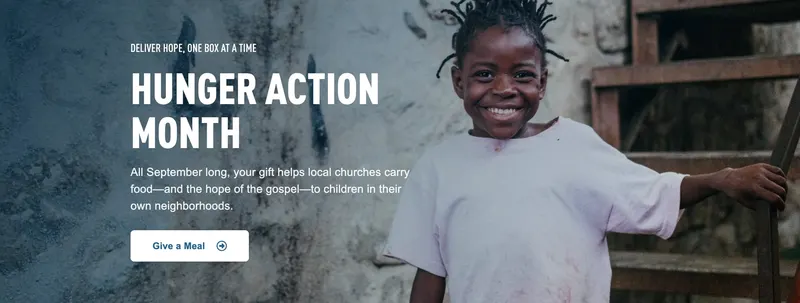
Every September, Hunger Action Month is one of Children's Hunger Fund's key campaigns. The old campaign page was a single monolithic template, and the ministry couldn't trace a donation back to the channel that produced it.
I rebuilt the page and its homepage banner, wrote the copy, built the event tracking and link-tagging plan behind it, and built a live dashboard to follow results during the month.
The page had three jobs:
- drive one-time and monthly (“Hope Partner”) donations through an on-page giving widget
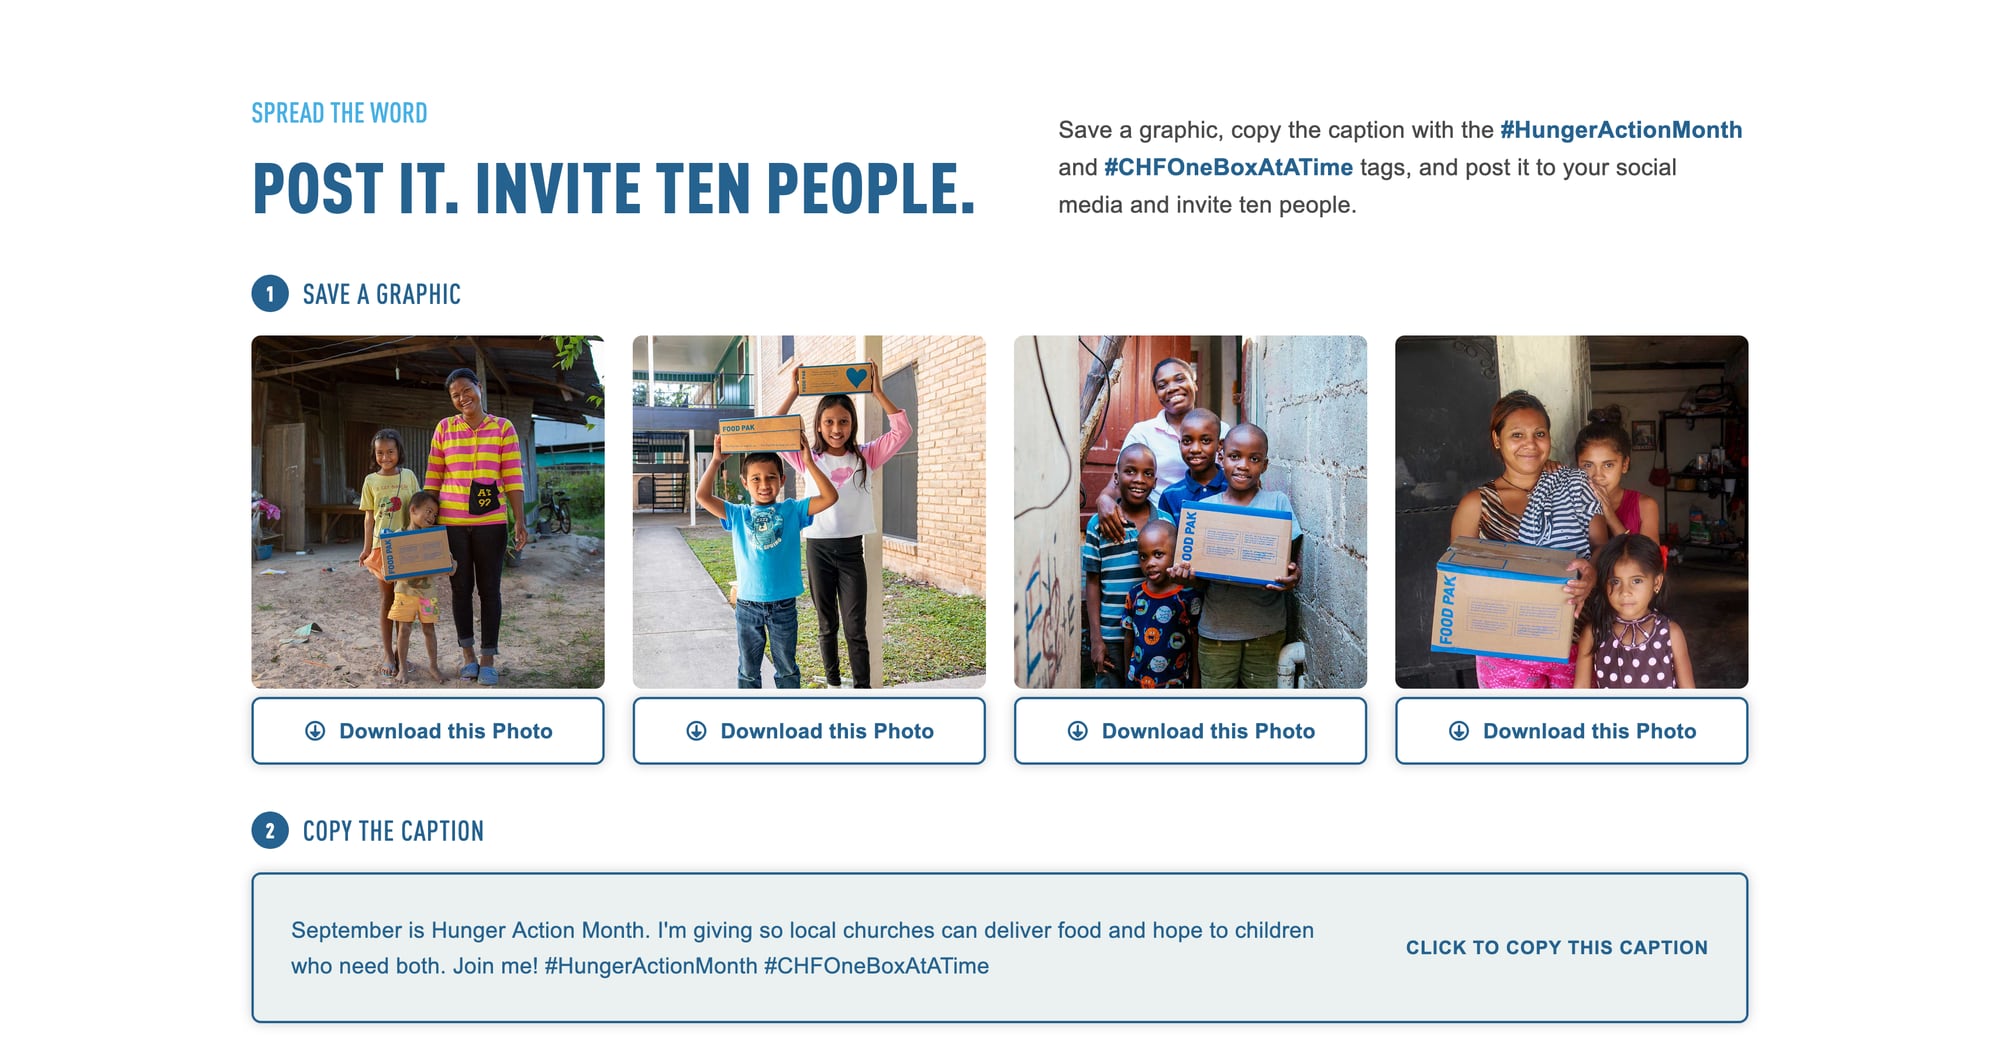
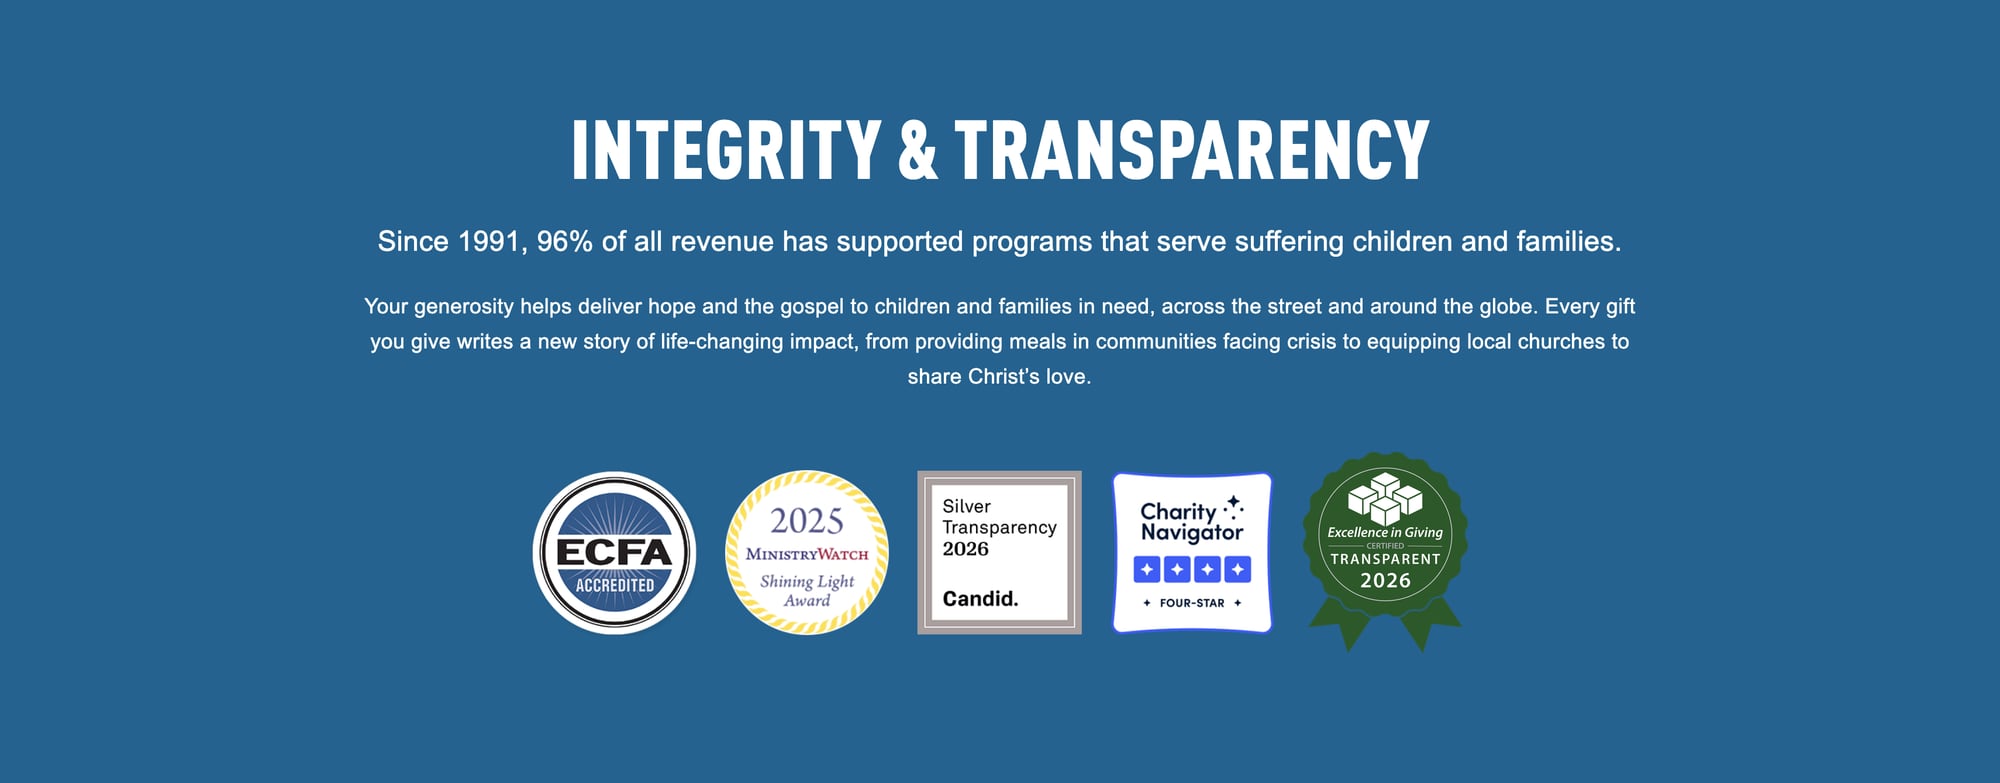
- build trust with new visitors and give supporters shareable graphics and captions
- give stakeholders one view of results, with live and daily-snapshot data kept separate
Loading video...
- 92
- Distinct donors, 9 of them monthly
- 3.7%
- Donation conversion rate
- 164
- “Give a Meal” clicks
- 49.2%
- Engagement rate
Results & Impact
The dashboard's snapshot of the campaign month shows 113 completed donations from 92 donors across 3,805 page views, with giving figures from Classy and behavior from Google Analytics 4.
It was the ministry's first campaign with full-funnel, cross-channel attribution from day one. Every email, paid ad, social post, QR code, and web placement was traceable from first click to completed donation, and the tracking foundation became the reusable template for later campaigns, including the year-end push.
See the Hunger Action Month campaign page live.
The Page
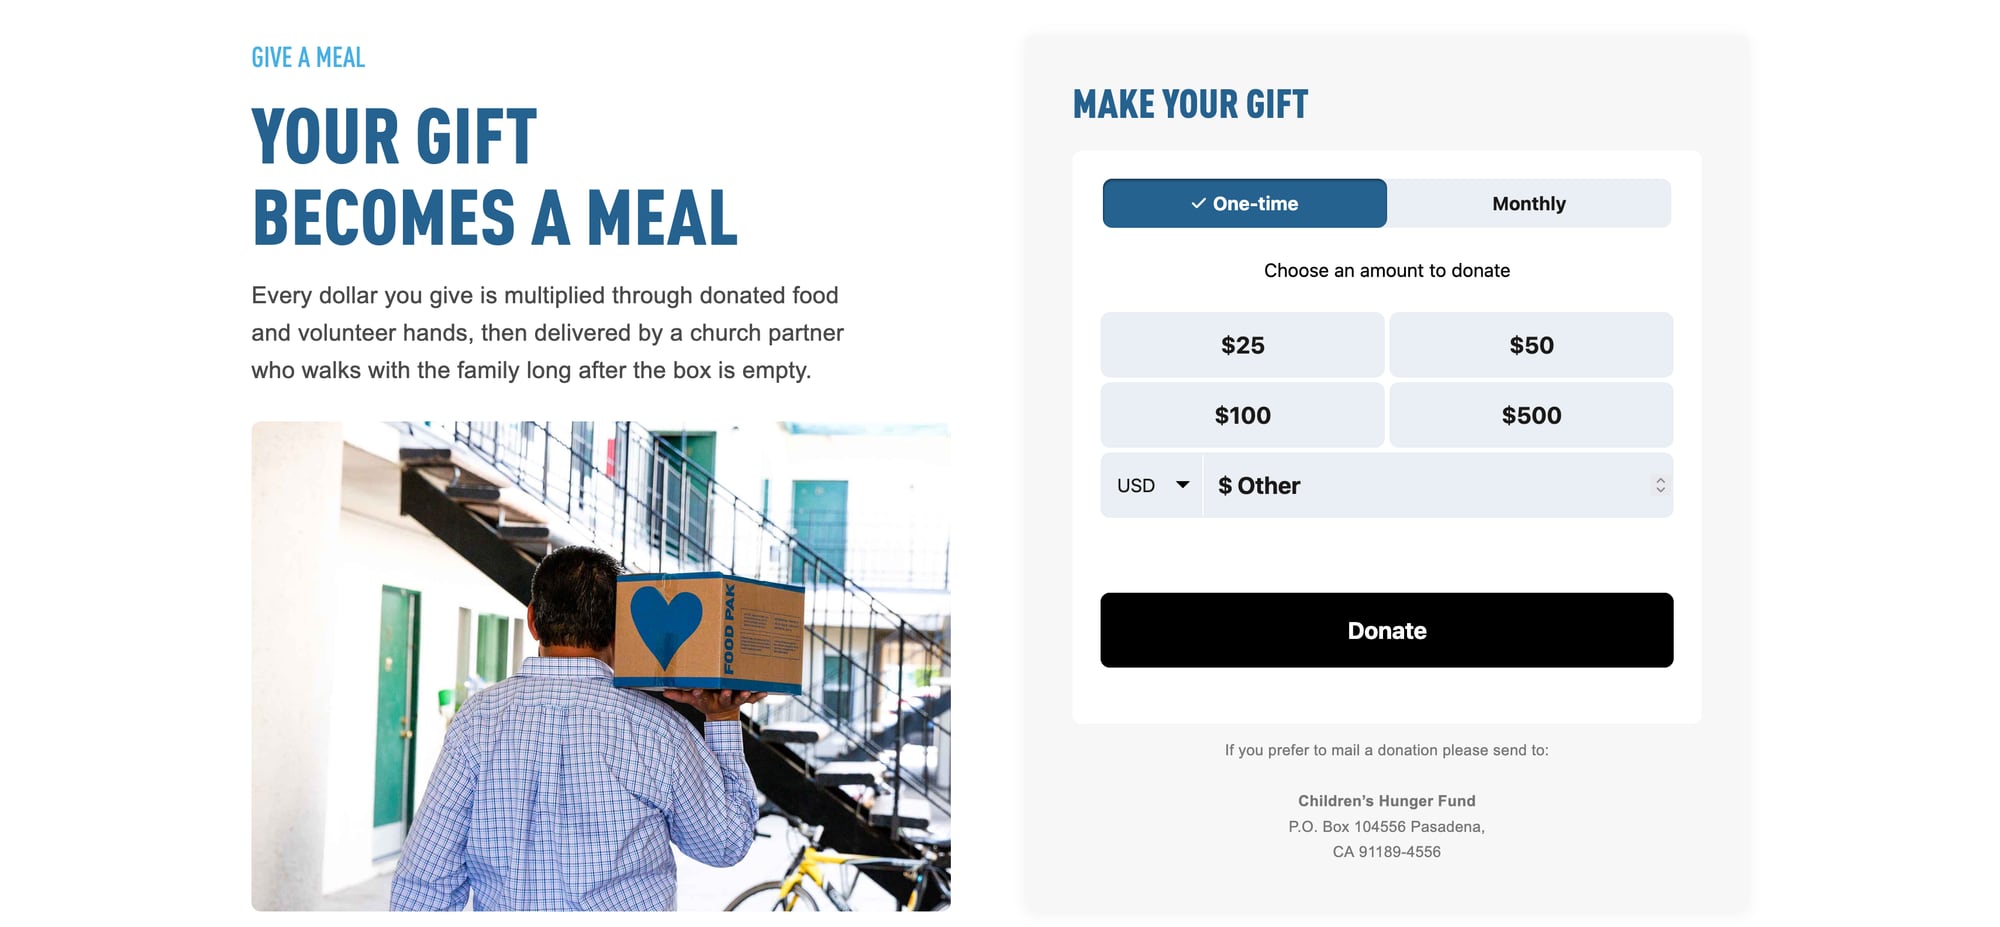
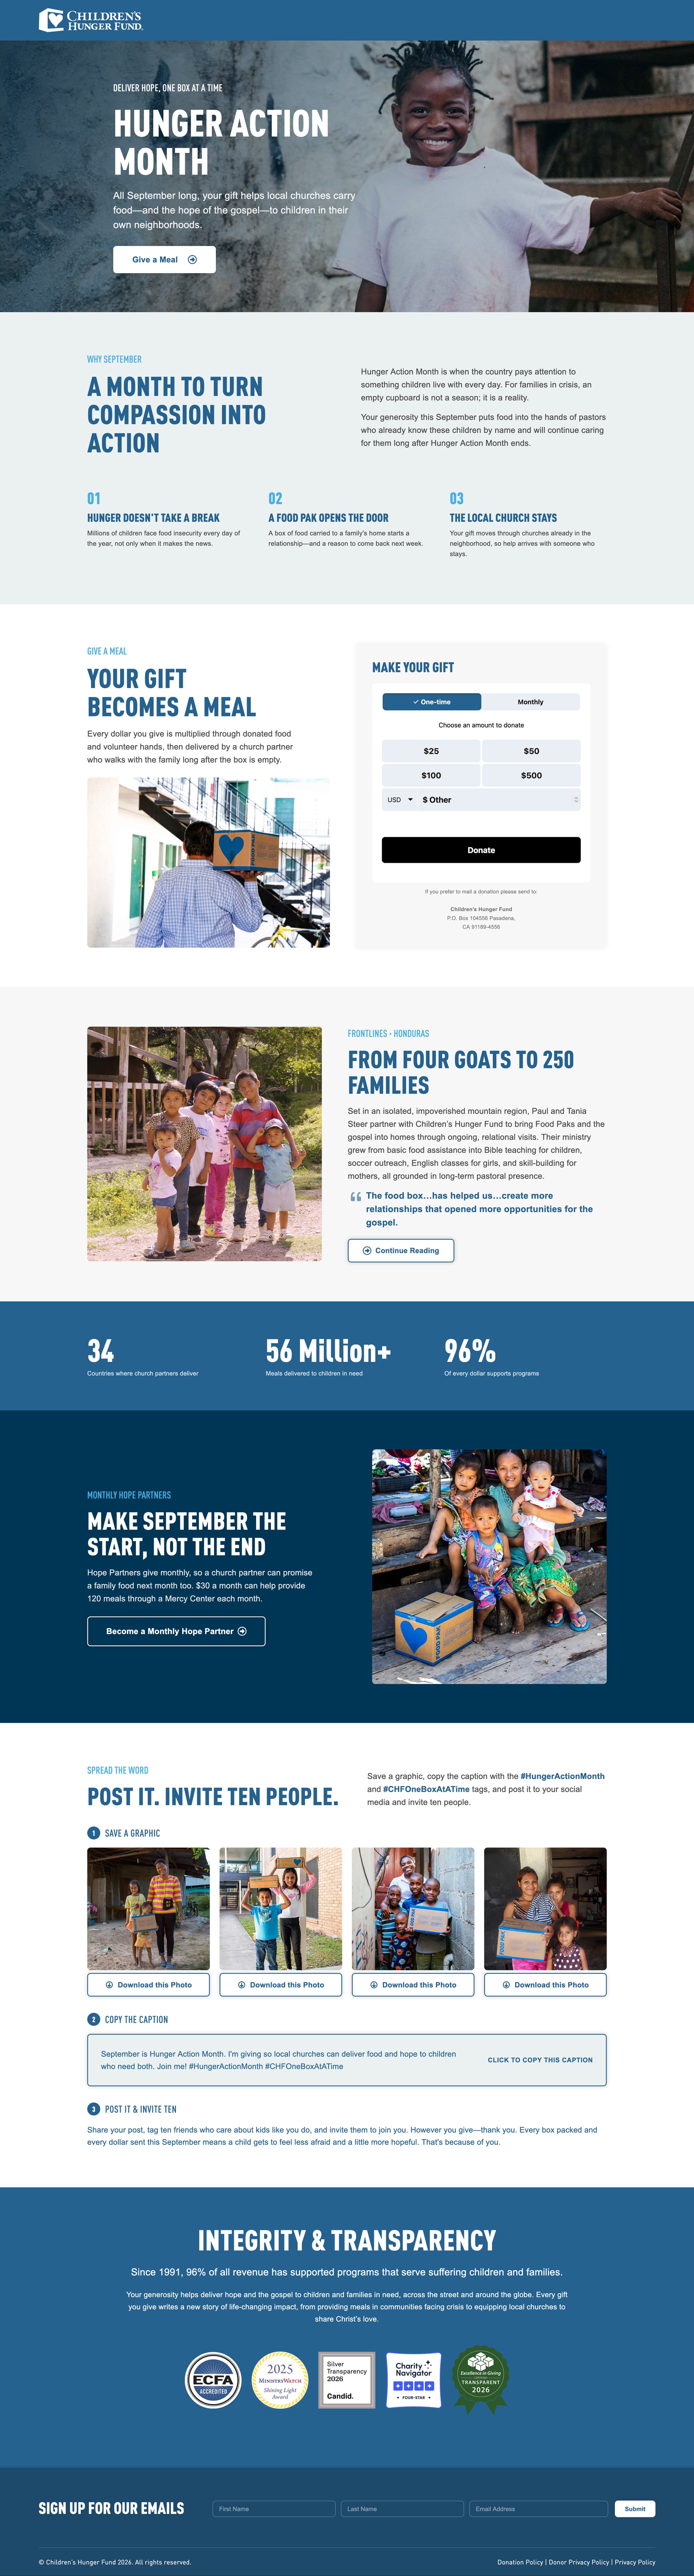
I rebuilt the page from one monolithic template into ten self-contained sections, so each can be edited, reordered, or reused in future campaigns without touching the rest. I also wrote the copy, turning the campaign brief into headlines, calls to action, and section text in the ministry's voice, so the words and the layout were shaped together.
A second pass focused on conversion, so every visitor has one clear path to giving:
- No exits. I removed the top navigation, leaving only the logo, the same distraction-free pattern I established on Giving Tuesday.
- Fewer competing asks. I cut a secondary actions section and an extra button, replaced two older action cards with one volunteer call to action, and brought the new embedded giving form above the fold.
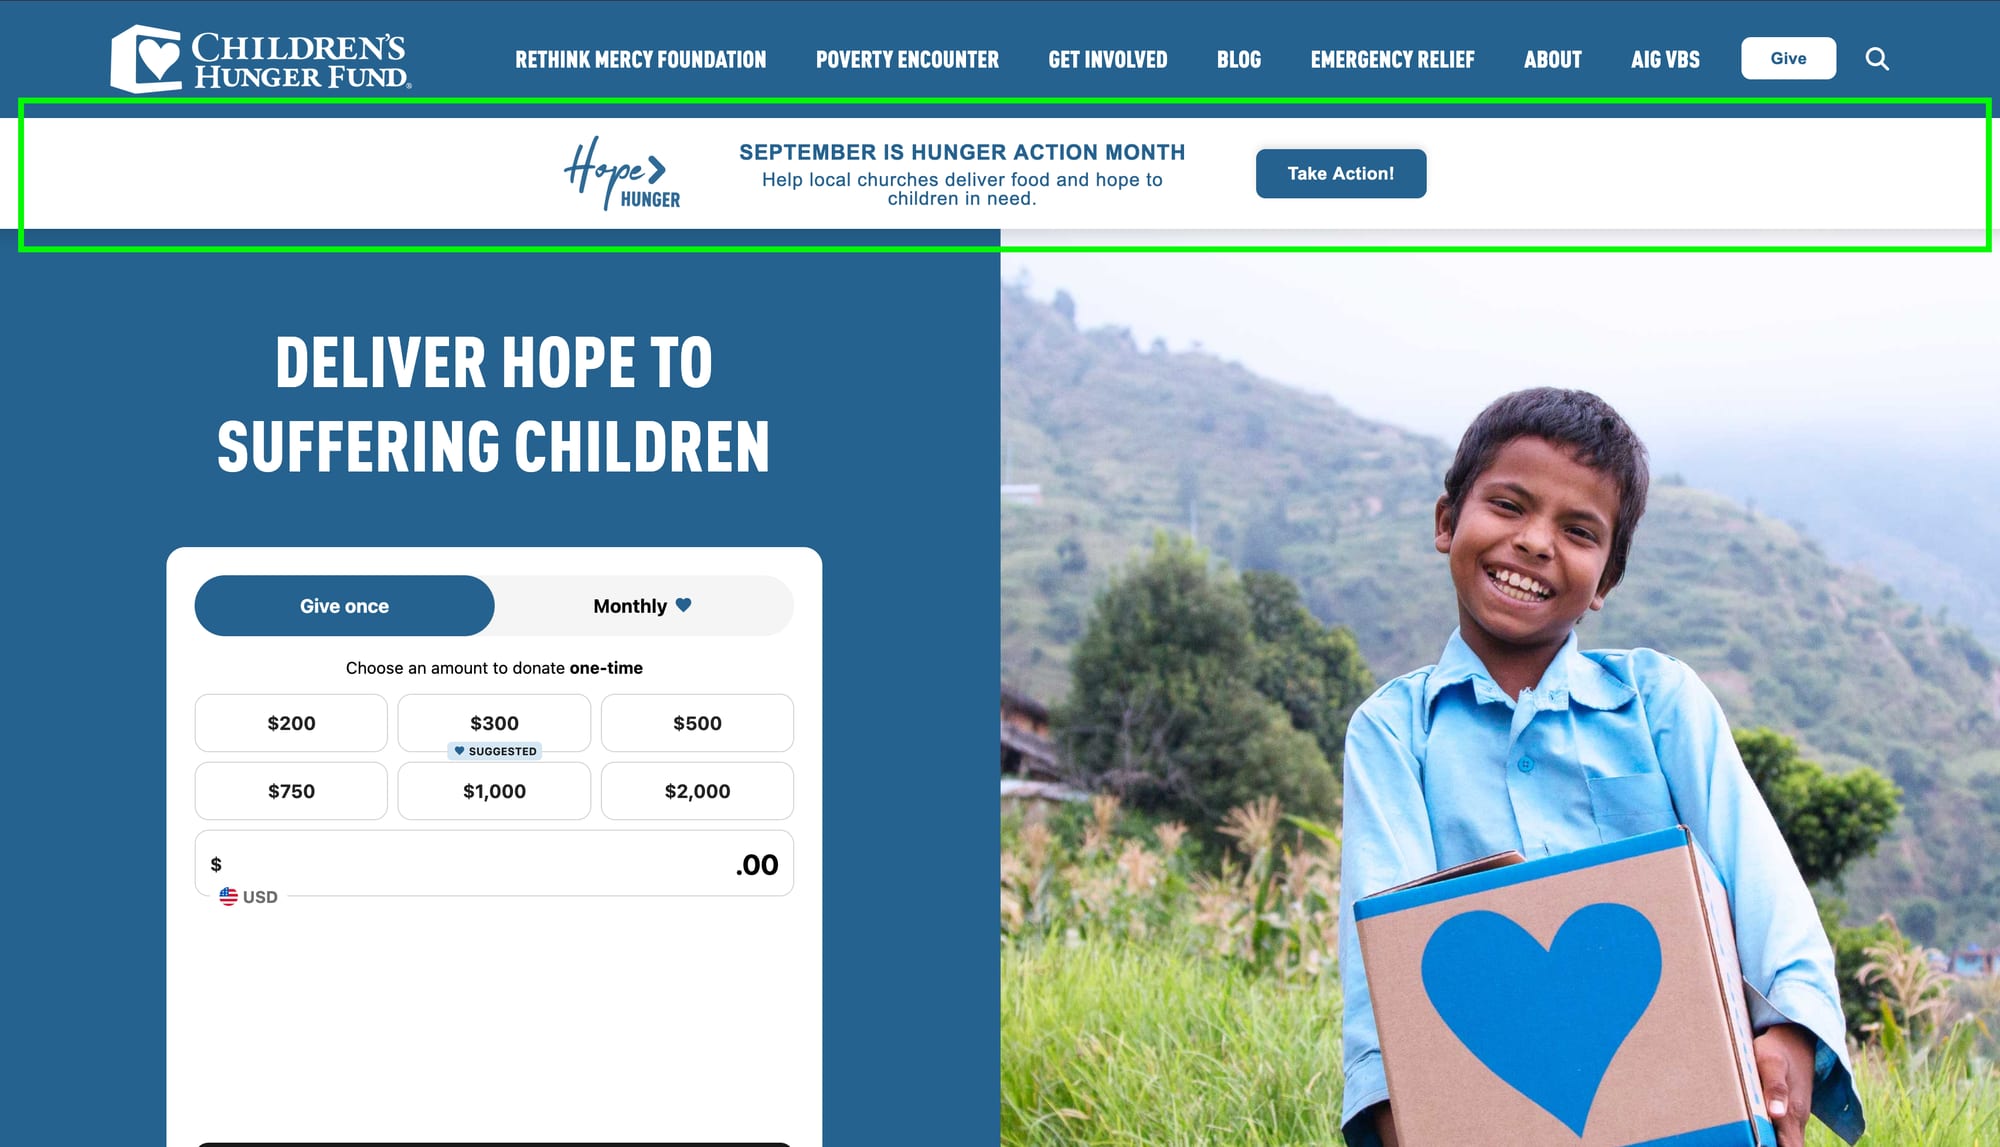
For the homepage banner, I worked with the Executive Director to sharpen the call to action from a generic “Deliver Hope” to the more active “Take Action!”, with one supporting line: “Help local churches deliver food and hope to children in need.” It went live when the campaign began, with a tagged link and donations coded to credit the campaign.


Tracking & Attribution
The centerpiece was a complete event-tracking layer in Google Tag Manager and Google Analytics 4, documented in an implementation report for the communications team, plus the plan for how every inbound link is tagged.
- Built on what was there. I aligned with the site's existing one-tag pattern, so each new interaction needed only a few new variables.
- Seven custom events, and donations as ecommerce. Events cover page views, call-to-action clicks, trust-badge clicks, graphic downloads, caption copies, and newsletter sign-ups. Checkout starts and completed donations are tracked through tag configuration alone, with no changes to the giving form.
- One link plan for every channel. 17 tagged links across eight channels, from email, social, and paid ads to search, print, QR codes, and internal placements, each with approved source and medium pairs, implementation notes for its owner, and one shared link generator validated against the plan.
- Clean and verified. Donors' personal details never reach analytics, donations are kept apart from other purchases, and all nine events were confirmed end to end in debug tools.
To follow the campaign live, I also built a private dashboard. Read about it in the Hunger Action Month Campaign Dashboard case study.
What the Data Showed
Because every step was measured, the dashboard showed where giving worked and where it stalled:
- Email beat paid social per donation. Paid social carried the traffic (2,313 visits, about 74% of the total, against 515 for email) and produced 78 donations to email's 7. But each email donation was worth roughly 2.7 times a paid-social one.
- Mobile did the giving. 74% of visits and 83 of the 96 donations GA4 tracked came from mobile, which backed the mobile-first build.
- Giving stalled at checkout and on monthly. 142 visitors started checkout and 113 completed. Monthly was selected 45 times against 21 for one-time, yet only 9 donors became recurring. Of 37 form errors, the most common was “Enter a state” (9), pointing at the address fields.
- Trust badges and the newsletter barely got used. Badge clicks totaled 8, and the newsletter sign-up saw 117 starts but only 4 completions, so visitors converted without them.
Learning & Next Steps
What I learned
- Measure value, not just volume: email sent far less traffic and was worth far more per donation.
- Interest isn't completion: monthly giving drew interest but few completions, so that flow needs testing.
- The page earned trust without the badges or the newsletter, so those elements deserve a rethink.
What's next
- Test the monthly-giving flow and fix the state and address-field errors.
- Move the newsletter sign-up and trust signals, or rethink them.
- Invest more in email, and reduce dependence on a single paid-social channel.
[ Let's connect ]
Let's work together
Have a project, a role, or an idea in mind? I'd love to hear about it.